


Waiting For Jerome - A Forecast For Precious Metal Prices In 2024

Well, it's that time again. Time to take stock of what we think we know going into the new year and then attempt to put it all together into what we call our "macrocast". Yes, it's a projection of where I see the precious metals heading in the year ahead, but it's also a summary of the economic conditions that I expect to drive the price trend. It's risky business and it's never easy to do. However, we're going to do it again anyway.
As we get started, please understand why I issue these macrocasts. It's not for clicks and publicity. It's not for publication at ZeroHedge and elsewhere on the internet. It's not for you, the reader, and it's not for the members of my TF Metals Report site either. I do this for me. Everything else is secondary.
What do I mean by that? Let me put it this way. This is my fourteenth year running the TF Metals Report website, and thirteen years of watching the COMEX precious metals every day has taught me a valuable lesson. Namely, that I can never stop learning and growing. To that end, how does one learn from his mistakes if he doesn't recall the rationale and thinking that led to the mistakes? How can you hold yourself accountable if there's not a record to which you are held to account?
So every year, in the first week of January, I write what I call a "macrocast". It's a summary of what I expect in the months ahead in terms of economics, politics, monetary policy, and geopolitics. All of this guesswork combines into a price forecast for the precious metals and mining shares. Sometimes I nail it. Sometimes I don't. But either way, I try to learn from my mistakes so that I can do a better job next time.
What were the mistakes of last year? Well, I made a few. For example, in January of 2023, there were all sorts of predictions regarding a pending shortage of above-ground copper. Electric vehicle demand was soaring, and copper supplies were dwindling. Even Goldman Sachs was predicting that above-ground copper could be "extinct" by late summer. Do you recall this chart?

If copper prices were set to soar in 2023, then surely silver prices would tag along for the ride. The problem is copper prices never soared, and there's seemingly plenty of copper still laying around. As such, spot copper began the year at $3.80 and finished the year at $3.85. How did silver do? It finished 2023 unchanged too. That's a good example of how, in a multi-variable system, if you get one variable wrong, it can mess up your entire forecast.
Another example...I thought the gold price would post a bigger rally than it did. Here's a screenshot taken directly from the 2023 macrocast:

I expected gold to break out of its 2020-2022 trading range and then trade to near $2300 before settling the year closer to $2200. Gold did in fact break out late in the year, and it traded to a high of $2122 on the evening of December 3. It then fell back but rallied again into year-end to finish at $2063 for a 13.1% gain. Was I right? Sort of. I was in the ballpark, and as you should know, being close only counts in horseshoes, hand grenades, and gold price forecasting.

The biggest thing I got wrong in 2023, though—and getting this wrong impacted everything else I was trying to forecast—was overall market liquidity. I need to understand the why and how I got this important factor wrong, and doing so presents us with the starting point for Macrocast 2024.
As 2022 ended, I really thought we could learn some important lessons from recent market history. For example, by late 2018, overall market liquidity had collapsed and the stock market was teetering on the edge of a sharp decline. The Fed responded with a pause to their rate hike schemes in December of 2018, and by June of 2019, they began cutting the fed funds rate. What was the signal of stress? To me it was the yield on the U.S. 10-year note, which had reached 3.25% by late 2018.
My thinking a year ago was that if the U.S. economy and markets couldn't withstand a 10-year yield of 3+% in 2018, how could it withstand 3+% in 2023? But the markets DID withstand higher rates in 2023. In fact, the yield on the 10-year note actually exceeded 5% for a few days in October! Yet the Fed and the markets just sailed along, apparently unaffected. Why? What had changed?
After giving this considerable thought over the past few weeks, I think I've figured it out. The year 2018 was pre-Covid, and as such, overall liquidity was already pretty tight after five years of Fed shenanigans like the so-called "Operation Twist". However, as the year 2023 began, cash was everywhere! The Fed had created over $5T in response to The Covid Crisis, and though much of this cash had been deployed across the U.S. economy (resulting in rapidly-rising inflation), The Banks were sitting on over $2T in cash that they had parked as "excess reserves" at the Fed's overnight reverse repo window.

In hindsight, it's clear now that this slush fund of "quarantined" cash was used to grease the skids of liquidity all through 2023. I had expected liquidity to run dry and force the Fed to restart rate cuts and QE by late summer. Instead, things just kept humming along on the back of over $1.6T in cash that exited the reverse repo program between March and year-end, leaving the reverse repo balance at just $665B as of January 4, 2024.

This leads us to the first Big Question of 2024: What happens when that reverse repo balance goes to zero? At its current rate of decline, a zero balance might be seen by late February or March. How will the Fed react? Powell was able to play the hawkish game all through 2023 with his "higher for longer" schtick. But that was only possible because the wheels of liquidity had kept turning. How will Powell respond if those wheels seize up and grind to a halt? It's pretty easy to talk a good game when your Banks are sitting on $2T in cash, but how fast do you change your tune when the funds run dry?
Which leads us to the next Big Question of 2024: Who's going to buy the debt? The U.S. is looking at a projected NET treasury issuance north of $800B in the first quarter alone. Where the heck is that money going to come from? You could say that reverse repo drain, as well as retail money funds, helped fund the treasury issuance last year. What about this year?
Further, accumulated debt and the interest cost to service that debt are both exploding higher and beginning their exponential and terminal phase. At TF Metals Report, we call this The End of The Great Keynesian Experiment, and you can see it on the charts below.


Now perhaps "the markets" recognize that the reverse repo slush fund is running dry. Is that why rate cut expectations grew steadily in December? After the rate hike pause announced at the December 13 FOMC meeting, the odds of a rate cut as soon as March exploded higher. In fact, by late December, "the markets" were pricing in a 95% likelihood of a March rate cut and the possibility of as many as SEVEN more cuts later in the year for a total of 200 basis points or 2%!

That seemed crazy to me, and I began to warn everyone at TFMR that we should expect some price weakness in early January as the rate cut expectations predictably came back to earth. Here are two shifts that were seen in just the first week of the new year:


As you can see above, there's now a 50/50 shot at a fed funds rate cut when the FOMC convenes in mid-March, and that seems about right. I mean, we're talking about 2.5 months from now and no one knows what the economic and geopolitical landscape will look like by then. We'll just have to see. In the meantime, I don't expect much upward price progress from the COMEX precious metals as the first few weeks of 2024 unfold.
But what about after that? Will the Fed cut in March? If not, how soon will they begin to cut? Will they fall behind the curve and react too late to a faltering economy or will the economy instead achieve the "soft landing" that the political economists keep raving about? That's another Big Question of 2024. The Fed themselves admit that rate cuts are coming this year as the December Summary of Economic Projections included an expectation of three. Will that be all, or will there be five? What if the markets were correct in late December and there ends up being seven?
At any rate, if I seem more focused than ever upon the Fed and monetary policy, it's for a good reason. You must understand that more than 80% of all U.S. trading volume is now conducted by High Frequency Trading (HFT) computers, which use pre-programmed algorithms in their decision-making process. On any given day, an economic datapoint or mutterance of a Fed Goon can set off these HFT programs with wild volatility. The overall daily trend and fundamental picture for gold might be overwhelmingly positive, yet if the dollar index spikes 75¢ on a random Tuesday, COMEX gold prices are going to get hammered. Check this chart from Friday, January 5. Note the near-perfect inverse correlation between the dollar index and COMEX gold. This is only possible when the HFT algos are in complete control of the day.

So with daily changes to the bond market (nominal interest rates) and the dollar index playing such a key role for all markets, Fed policy—and the perception of future Fed policy—becomes the primary 2024 driver of the COMEX gold price, at least during London and New York trading hours.
And this is what makes forecasting the gold price in 2024 far more difficult than in years past. The economic system is quite literally chaos, with an almost infinite number of variables to consider. How can you know which variables will take the most prominence in affecting Fed policy? You can't...and that's the problem/challenge.
Consider this: 2024 is a presidential election year in the United States. How will that simple fact alone impact the Fed? Will they be pressured to cut rates to stimulate the economy for the incumbents? But what if they do and then inflation returns with a vengeance by autumn? Then, suddenly, the Fed may be pressured to stop cutting and perhaps even hike again. What if that’s how the year plays out? And again, this is just ONE of the endless variables that must be considered.
I suppose I could just throw a number out there and predict a moonshot. That would be easy and it would get a lot of clicks, but what would be the point? Again, these macrocasts are first and foremost written for me so that I can hold myself accountable. As such, I take them very seriously, and I try to issue as accurate a forecast as possible, based upon what I think I know as the year begins.
So, let's go for it. Here's what I think is the most likely scenario for gold and silver in 2024.
Any look forward should begin with a look back. Where did gold finish the previous year? In what sort of shape is the current chart? What is the current setup of the Commitment of Traders report? How strong is physical demand as we exit 2023? I'm happy to report that 2024 begins with positive answers to all those questions.
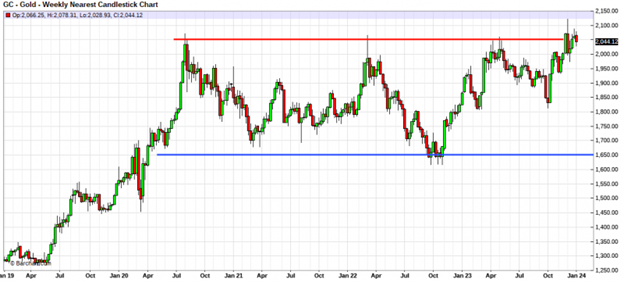
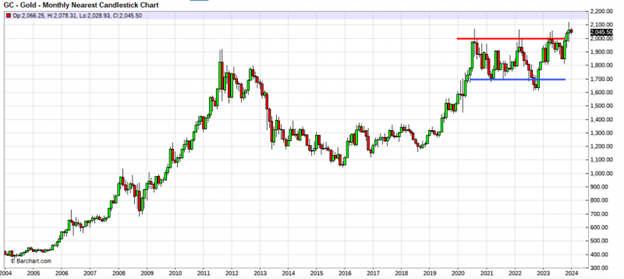
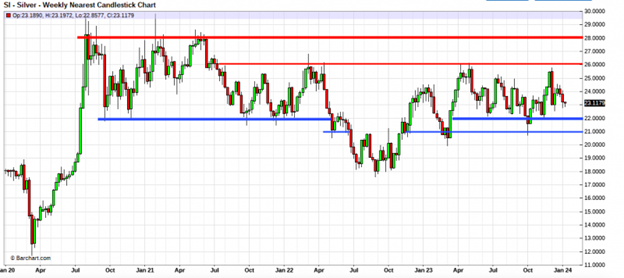
Spot gold prices finished 2023 at all-time highs on the monthly, quarterly, and annual charts. That's a rare trifecta that almost included the weekly and daily charts too. It seems that the entire investment world is watching and waiting for a breakout on the long-term charts, and as 2024 begins, we're awfully close. Here's a weekly chart with the consolidation area between $1650 and $2050.
However, on the monthly chart—and the longer the term, the better—the consolidation range is tighter, and you can plainly see an ongoing breakout. The longer this breakout holds above $2000, the more likely generalist investors will be drawn to gold.
In the short term, however, the issue is those pesky rate cut expectations. As the over-exuberance of late 2023 gets replaced with something more reasonable, gold is subject to a pullback. Nominal interest rates may rise a bit in January, and this will prompt the dollar index to rise too.
We're already seeing this in the first few days of the new year. Gold prices declined about $20 between January 2 and January 5 as the yield on the U.S. 10-year note rose back above 4%. And for what it's worth, keep this little tidbit in mind: Over the past ten years, there is at least some correlation between annual performance and the price action in gold over the first week of the year. It's not a perfect correlation by any means, and we're only talking the last ten years here, but this is something you should note.

You must also NEVER FORGET that the bullion banks are going to fight price gains every step of the way. Whenever gold breaks out to new all-time highs, every single paper short ever created (naked or hedged) is underwater. As such, when spot gold posted its first ever $2000+ monthly close in November 2023—and then followed that up the next day with a $33 gain on the first day of December, thereby posting its highest weekly close of all time—The Banks immediately set a trap shortly after trading resumed on Sunday, December 3.
At 6:15 that Sunday evening, The Banks allowed for a quick, $60 price surge, into which they aggressively shorted, "tamped", and capped. The resulting reversal painted a very ugly candle onto the daily chart and prompted many generalists to proclaim a short-term top. As such, instead of a painful breakout squeeze, The Banks were able to manipulate price at the lowest volume period of the week, thereby easing the stress that was being placed on their ever-present short position. As new all-time highs are made in 2024, you should expect to see more of these overt manipulations.


This is not to say that price CANNOT move higher. Of course it can. Price has rallied this century from $300 to $2000 or almost 7X. It's just that The Banks can be expected to manage the price gains along the way. Seeing price move up 10% in a year is something that The Bank trading desks can deal with and profit from. Seeing price move up 50% in a year would be a catastrophe for them, and you must always expect them to act accordingly.

So, keeping all of this in mind...
1. The unpredictability of Fed monetary policy
2. Election year shenanigans
3. Increasing need for the Fed to provide bond market liquidity
4. Omnipresent and pervasive bullion bank price management
...I think we need to temper some of our enthusiasm for significant price gains in 2024. It's going to be a good year, but it will be defined by periods of sharp pullbacks and doubt, similar to what we just experienced in 2023. To that end, it seems reasonable that the 2024 gain for gold in dollar terms should come in near the long-term average of 8-10%.
$2063 + 9% = $2248
That sounds about right, and it also sounds a lot like my 2023 price forecast. As noted above, last year I expected a recession and a Fed pivot to rate cuts by late 2023 and that this would prompt a breakout rally to $2300 before an end-of year pullback to $2200. As it turns out, I wasn’t necessarily wrong about that as much as I was just early.
I now expect a recession and Fed pivot by summer 2024, which will prompt a breakout rally to $2300 before an end-of year pullback to $2200-2250.
Perhaps I’m wrong about this and things will get out of hand in 2024 as the reactive Fed is once again late to step in. The stock market begins to crash, banks fail, and the dollar tanks. In an election year, the Fed will do everything it can to keep the politicians happy (think 2008), and they panic with "emergency" rate cuts and assorted new alphabet soup lending programs. If that's the case, then $2500-2700 is possible, but again, I just don't think that sort of thing is likely in 2024. Maybe in 2025, but not this year.
OK, so if gold is heading to $2300 at some point, then silver has to tag along, right? RIGHT??? Well, after last year, I'm not so sure about that. Yes, at $2300 gold and $23 silver, we'd be looking at a 100:1 gold/silver ratio and that seems pretty extreme. However, 100:1 is not unprecedented, either, as you can see on the chart below.

Notice that the long-term average of the gold:silver is somewhere near 80 or 85:1—or about where we are right now as 2024 begins. So, if that doesn't change much—and I suspect that it won't—a 2024 year-end gold price of $2250 implies a year-end silver price of just $26 or $27. While that doesn't seem like much to us silver stackers, a 2024 close near $27 would compute to a 13% gain versus the $23.80 close of calendar year 2023. Not terrible, but not much fun either.
And I can see where the process of getting to $27 by year-end is going to drive a lot of us crazy too. The back half of 2023 was defined by a trading range between about $23 and $26. Each time price approached $23, The Banks moved net long and the hedge funds moved net short, and each time, a short squeeze followed. As the squeezes continued toward $26, The Banks moved net short and the hedge funds got long—and prices reversed lower. This is a very profitable trading pattern for the bullion bank trading desks, so I would expect them to try to keep it going for as long as possible in 2024.

On the weekly chart, the resistance near $26 is easily defined, and getting above that level will continue to be difficult in 2024. At some point, though, price will get through there. The break of $26 likely comes shortly after gold breaks free of $2000-2100 later this year. This leaves $28 as the next major resistance level, and The Banks that dominate COMEX silver can be expected to work overtime to keep price below that key breakout level. Keep an eye on $22 and $21 as important levels of support when looking to acquire physical silver on price dips.
While I thought that COMEX silver could trade as high as $36 last year on a COMEX gold breakout to $2300, this year I'm not so optimistic. With The Banks clearly standing in the way—and without a boost from rising copper and other commodities—it just seems that silver will remain stuck in its current rut. Price should rally toward $28 at some point this year, but I don't expect a breakout. Instead let's look for a year-end price of $26 to $27. As mentioned above, a 13-15% annual price gain isn't terrible, but I know it's not what most of us are hoping for either.
And that brings us to the final section of our 2024 macrocast. What's in store for the mining shares? Any consideration of the sector must always follow a discussion of silver. Why? Because the long-term correlation of mining share prices to the COMEX silver price is something that cannot be ignored.
Maybe you're unaware of this important, HFT algo-driven relationship, but if you're investing in the mining sector, you'd better stop right here and read this next link. I've written about the correlation between COMEX silver and the GDX many times over the years. Here's the most recent article, written in June of last year.
And you can see this correlation on the charts below, where silver is shown in candlesticks and the large mining share ETF, the GDX, is shown as a blue line. First, here's the last six months:

But six months aren't conclusive enough. How about the last twelve months?

Not convinced yet? How about the last five years?

Still on the fence? How about we go all the way back to the gold and GDX price peaks of September 2011? Take a look below:

Maybe next you'd like to hit me with that pseudo-intellectual, "correlation is not causation" stuff. Go ahead, knock yourself out. However, in the heavily-manipulated world of digital derivative precious metal pricing, it sure seems to me that The Banks are onto something here. In "the West", overall investor sentiment is driven by price, especially mining sector share prices. If The Banks can run HFT algos that attach the mining shares to silver—and if those same Banks can easily manipulate the silver price on a daily basis—then The Banks can control sentiment for the entire sector by managing the silver price.
Does that sound crazy? Do you think these are just the deranged and delusional writings of a "gold bug" who doesn't understand how the markets operate? Maybe you're right. But then again, maybe you should scroll back up and take another look at those four charts.
So for me, it's pretty simple. If you can predict where silver is headed, you can largely predict where the mining shares are headed too. As such, if my year-end price target for COMEX silver is around $27, then that computes to a GDX up near $36 or so, which sounds about right. The GDX finished 2023 at $31.01. A move in 2024 to $36 would be a 16% gain, and once more, while that's nothing to get overly excited about, we'd all take that over a 16% loss.
Additionally, just as silver will be butting up against long-term resistance near $28, you can see a nearly identical pattern in the GDX with major resistance at $36. So all of these numbers seem to align for my 2024 GDX target of $36. Will 2025 finally bring a breakout of what I call "The Mother of All Pennants" on the chart below? Maybe. But a breakout doesn't look likely for 2024.

So there you have it. This year's macrocast may not be as exciting as other forecasts you've seen. And maybe economic and geopolitical events will conspire to make my forecasted results seem way too pessimistic. We'll see. But given what we just went through in 2023—and given what we know right now as 2024 begins—here again are my three projections:
1. COMEX gold breaks out and trades to $2300 before falling back and finishing the year closer to $2200 and an advance that is in line with the average annual gain seen this century.
2. COMEX silver attempts to tag along, but relentless Bank price management forestalls the trading range breakout that COMEX gold will experience. As such, silver trades to near $28 before settling back to $26 or $27 by year-end.
3. And the mining shares never catch a sustainable bid. There will, as usual, be periods of sharp rallies, and active traders may be able to benefit from the volatility. However, in order to break out, the mining sector needs a rush of generalist investor cash, and with COMEX precious metal prices only stable-to-slightly higher, it's difficult to envision a scenario that sparks general investor interest. Therefore, with silver remaining trapped below $28, the GDX remains below $36.
OK, that's it. Feel free to bookmark this page and refer to it as the year progresses. As always, I'm certain to get a few things right but I'll get a few things wrong too.
And please consider joining us at TFMR. Not only do I provide analysis and podcasts every day, the global community of TFMR members makes our site a safe harbor in the economic and political tempest. In times like these, we all need someplace where we can freely discuss issues and share information, and $15/month for TFMR access is money well spent. The world in 2024 is a complex place. Join us at TFMR and we can help you make some sense of it.
Thanks for taking the time to read this post.
CEH
Don’t miss a golden opportunity.
Now that you’ve gained a deeper understanding about gold, it’s time to browse our selection of gold bars, coins, or exclusive Sprott Gold wafers.


About Sprott Money
Specializing in the sale of bullion, bullion storage and precious metals registered investments, there’s a reason Sprott Money is called “The Most Trusted Name in Precious Metals”.
Since 2008, our customers have trusted us to provide guidance, education, and superior customer service as we help build their holdings in precious metals—no matter the size of the portfolio. Chairman, Eric Sprott, and President, Larisa Sprott, are proud to head up one of the most well-known and reputable precious metal firms in North America. Learn more about Sprott Money.
Learn More

You Might Also Like:

Looks like there are no comments yet.